Rightboat — marine marketplace
Design System & the Figma-to-Code Pipeline
Two years, three engineers, no system to start from. The redesign paid for the system; the system is why each quarter starts from the last one.
- Role
- Product & Brand Designer · Design System Lead
- Timeline
- July 2024 → present · quarterly releases, design system on retainer
- Team
- Product Manager, Engineering Lead, 3 Frontend Engineers, Data Analyst
- Tools
- Figma, Figma MCP, Code Connect, Next.js, TypeScript, Cursor, Claude Code
+55%
leads per page view
+61%
email leads per month
flat
traffic — none of it bought
System — as of August 2026: design and code verified against each other token by token — 53 raw hex values → 0, third-party library instances → 0 across 20 live pages.
Impact — client KPI sheet, Sep 2025 → Feb 2026:
- Leads per page view: 0.0038 → 0.0059 · +55%
- Email leads: 3,942 → 6,336 per month · +61% (+54% YoY in February)
- Multi-leads: 913 → 2,296 per month — buyers contacting more than one seller
- Page views: ~1.04M → ~1.08M · flat. None of the lift came from more traffic
Jobs-to-be-Done
I want a place where I can enjoy and relax with friends and family and live my passion for the sea without the cost of a new boat.
Functional: access boats within budget · Emotional: relax and disconnect · Social/identity: live my passion for the sea · Tension: without the financial barrier of a new boat
The Challenge
Rightboat.com is the world’s leading boat marketplace — but in a category where boats cost hundreds of thousands, the platform hadn’t kept up.
Three engineers were carrying a redesign, a feature roadmap and technical debt at the same time. That math only works if each quarter inherits the last one — so the redesign and the design system were built as one piece of work. The redesign paid for the system; the system is why the redesign kept compounding.
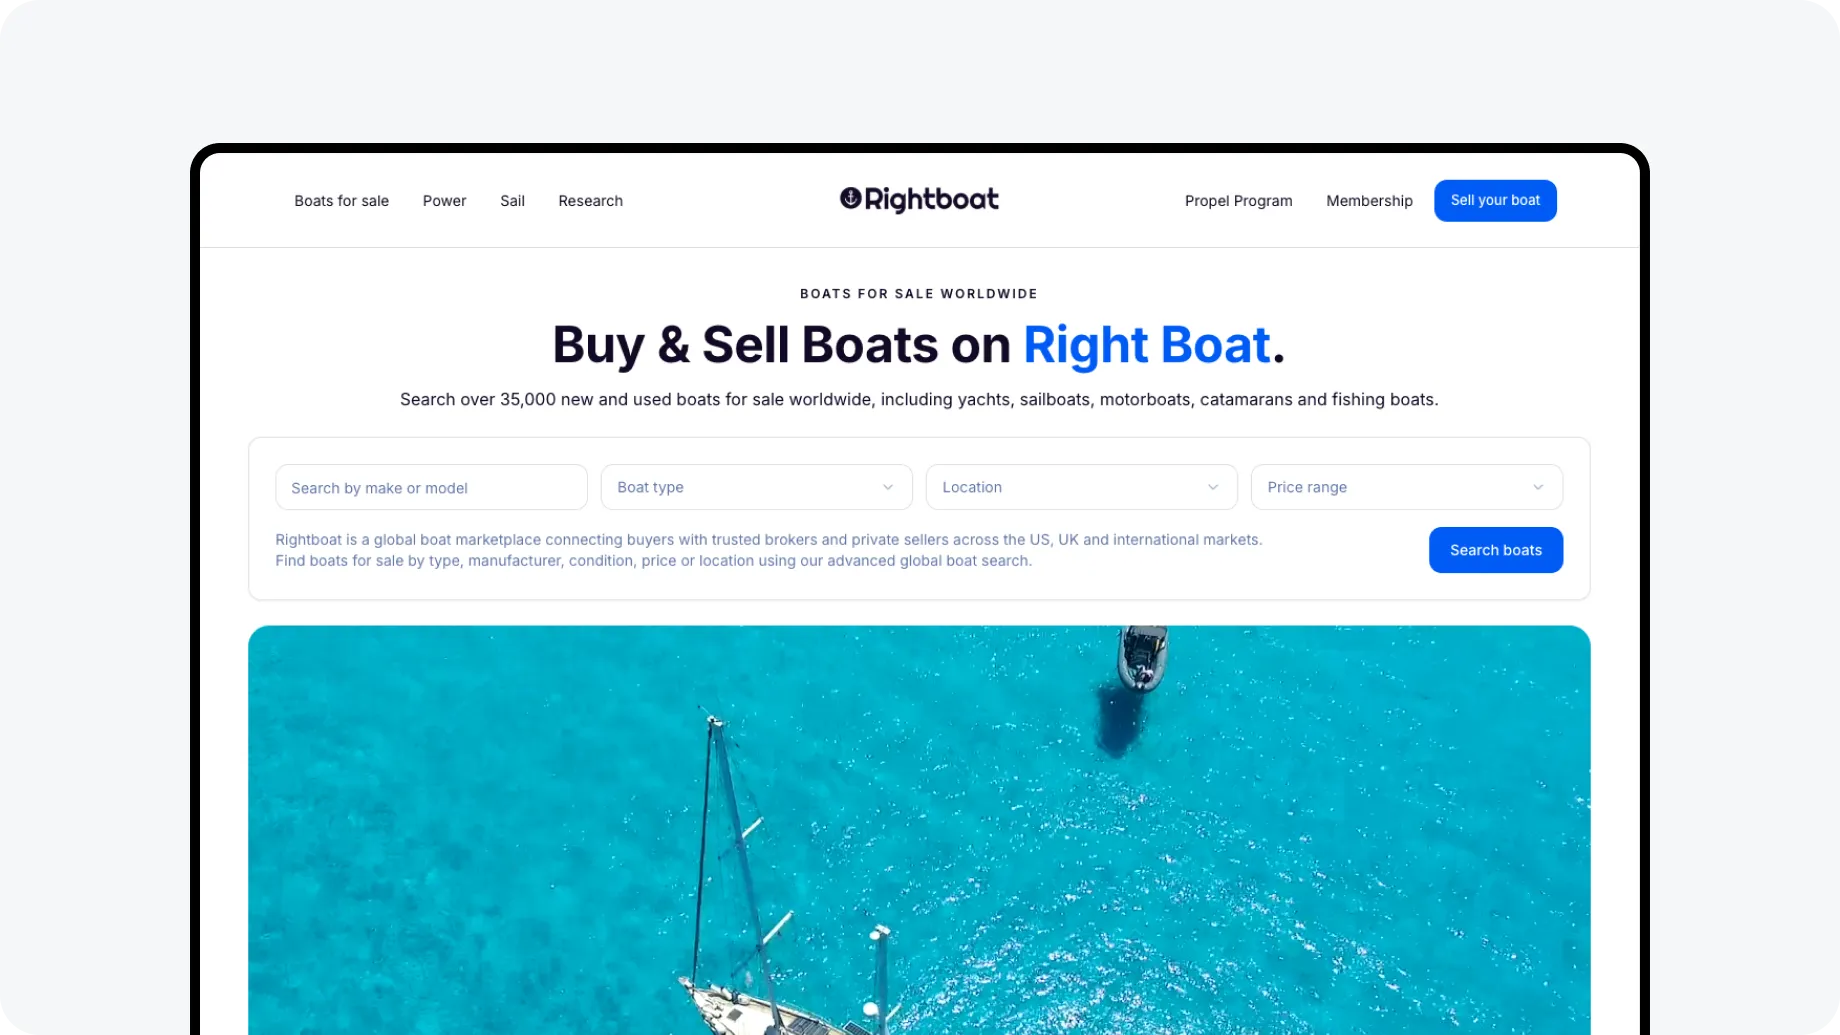
The real constraint was underneath. Cluttered homepage, dense search results, buried detail-page information, weak trust signals, broken mobile — and no design system. Every component was a one-off, so every quarter started from zero.
Key Constraints
- 3 engineers for everything — redesign, features and tech debt. Quarterly phased releases: ship value continuously, never a big bang.
- No system to start from — components were built in parallel with the redesign, not before it. Nothing was designed twice.
- Two-sided marketplace — buyers and sellers want opposite things. Every component and every feature evaluated through both lenses.
- Mobile growing, desktop converting — 20% YoY mobile growth, 70% of conversions on desktop. Mobile-first components, desktop variants on every one of them.
Building the System — El Captain DS
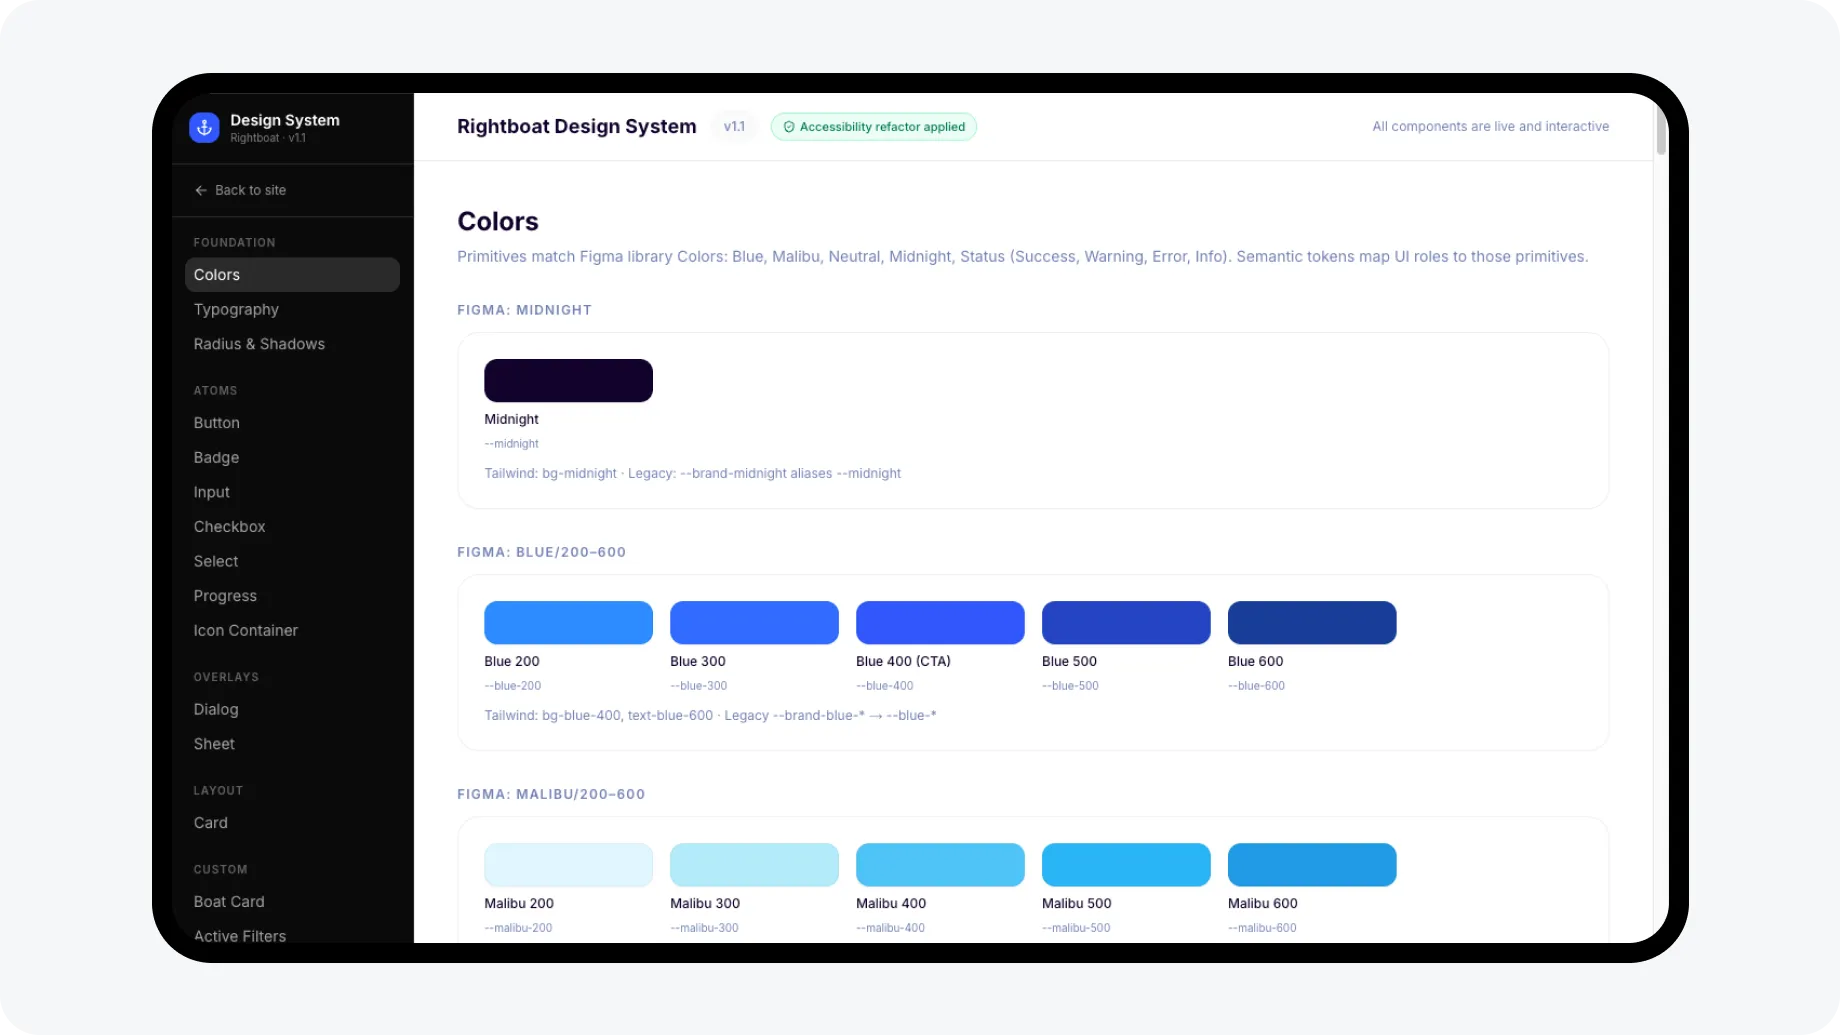
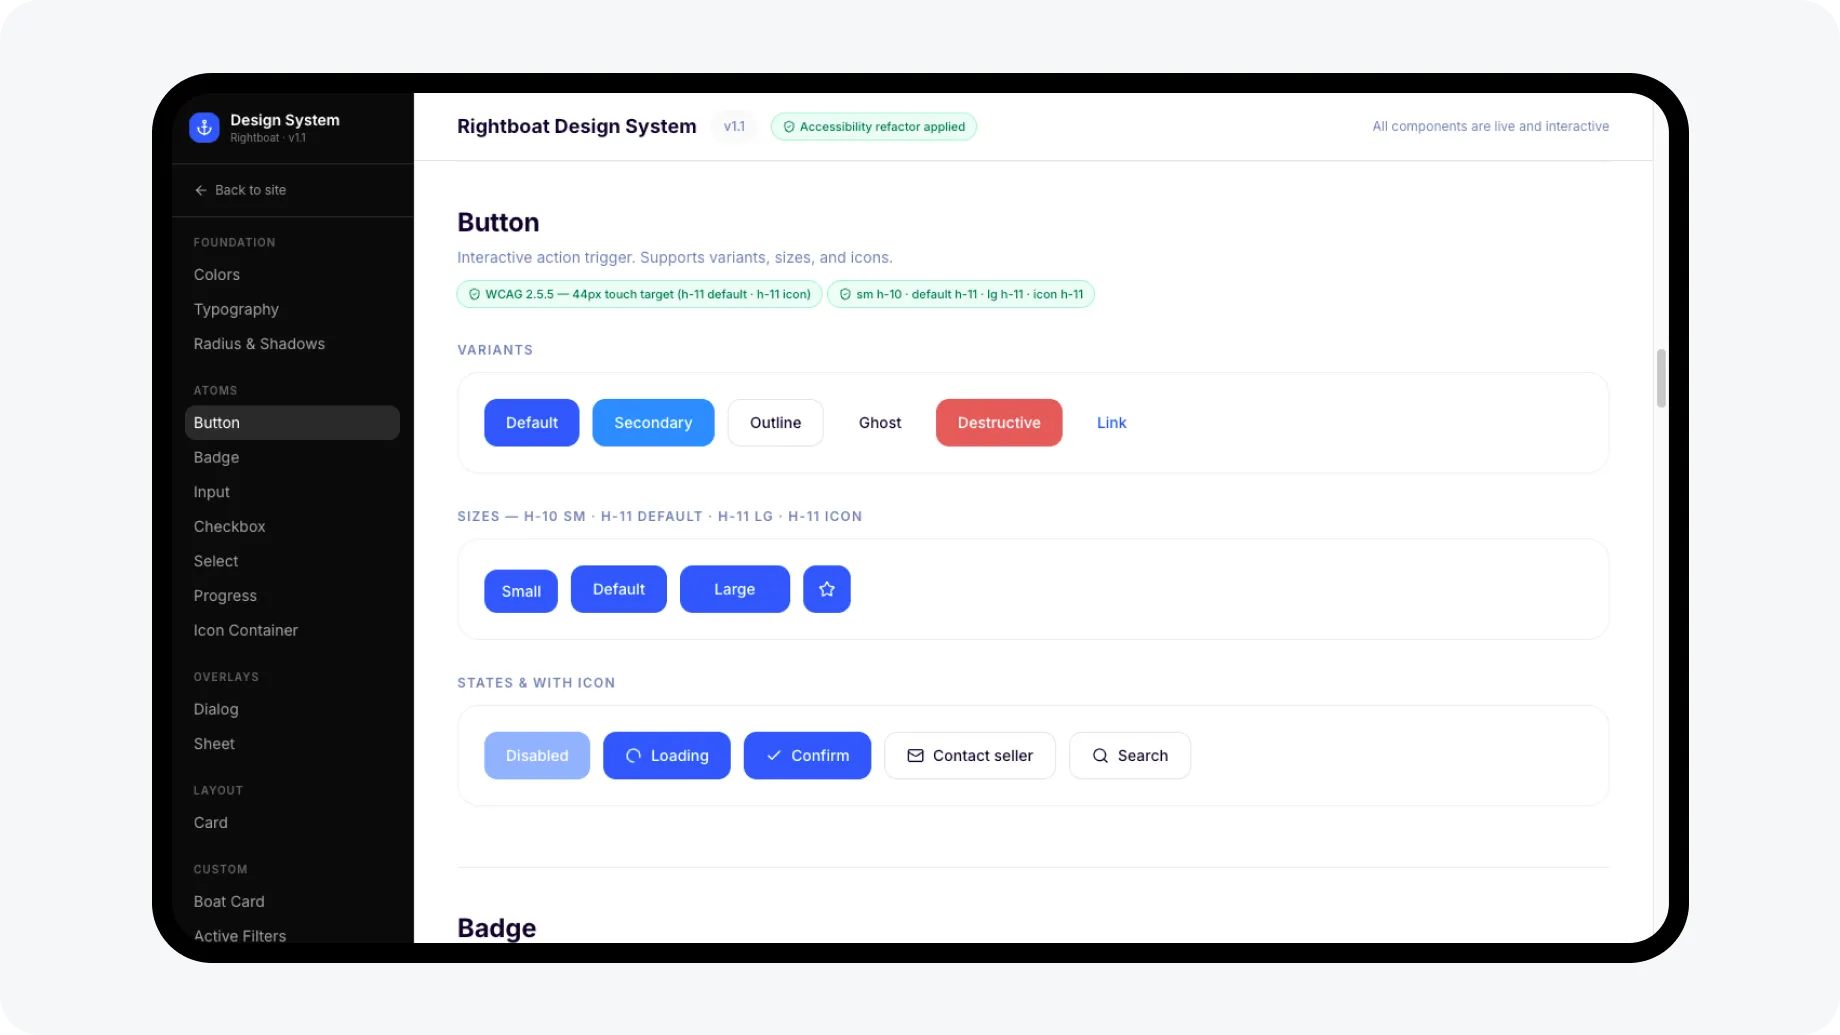
Foundations, primitives and patterns, with desktop and mobile variants on each: 17 primitives and 18 patterns, on a color foundation of 36 primitive variables across 5 ramps and 23 semantic tokens carrying Light and Dark modes.
The sequencing was the decision. A system built up front, before the redesign, would have been a guess about components nobody had shipped yet. A system built after would never have been funded. So each quarter’s screens were the brief for that quarter’s components: the detail page produced the disclosure and gallery patterns, search produced the cards, the filters and the pagination rules, the homepage produced the boat card and its four real variants.
The point isn’t the inventory. It’s that the fifth quarter costs less than the first — same three engineers, same traffic.
The Pipeline: Figma ↔ Code
A design system that lives only in Figma is a mood board with rules. The work that made this one real is the connection between the file and the running code.
Code Connect. 39 mapping files, 66 connected blocks between the Figma library and the React components. In Dev Mode, an engineer opening a component sees the real import and the real props from the codebase — not a redraw of what the frame looks like.
A navigable React prototype. Next.js 16, React 19, TypeScript, Tailwind v4, shadcn/ui, built with Cursor and Claude Code — the repository is public. It’s where decisions get argued before they ship: stakeholders click real pages, engineers use it as production reference, and every significant change to search goes out behind an A/B test.
Figma read directly by the agent. Through Figma’s MCP server the file is queryable — pages, variable collections, nodes by id, screenshots — and writable through the Plugin API. Combined with Code Connect, the agent references components instead of inventing them. Figma measured that pairing at −29.5% tokens, −19.6% duration and +1 quality point across 27 design-to-code tasks.
The chain reaches the prototype today. Production runs on Rails with compiled Tailwind and isn’t connected yet — see What’s Next.
The Product Work
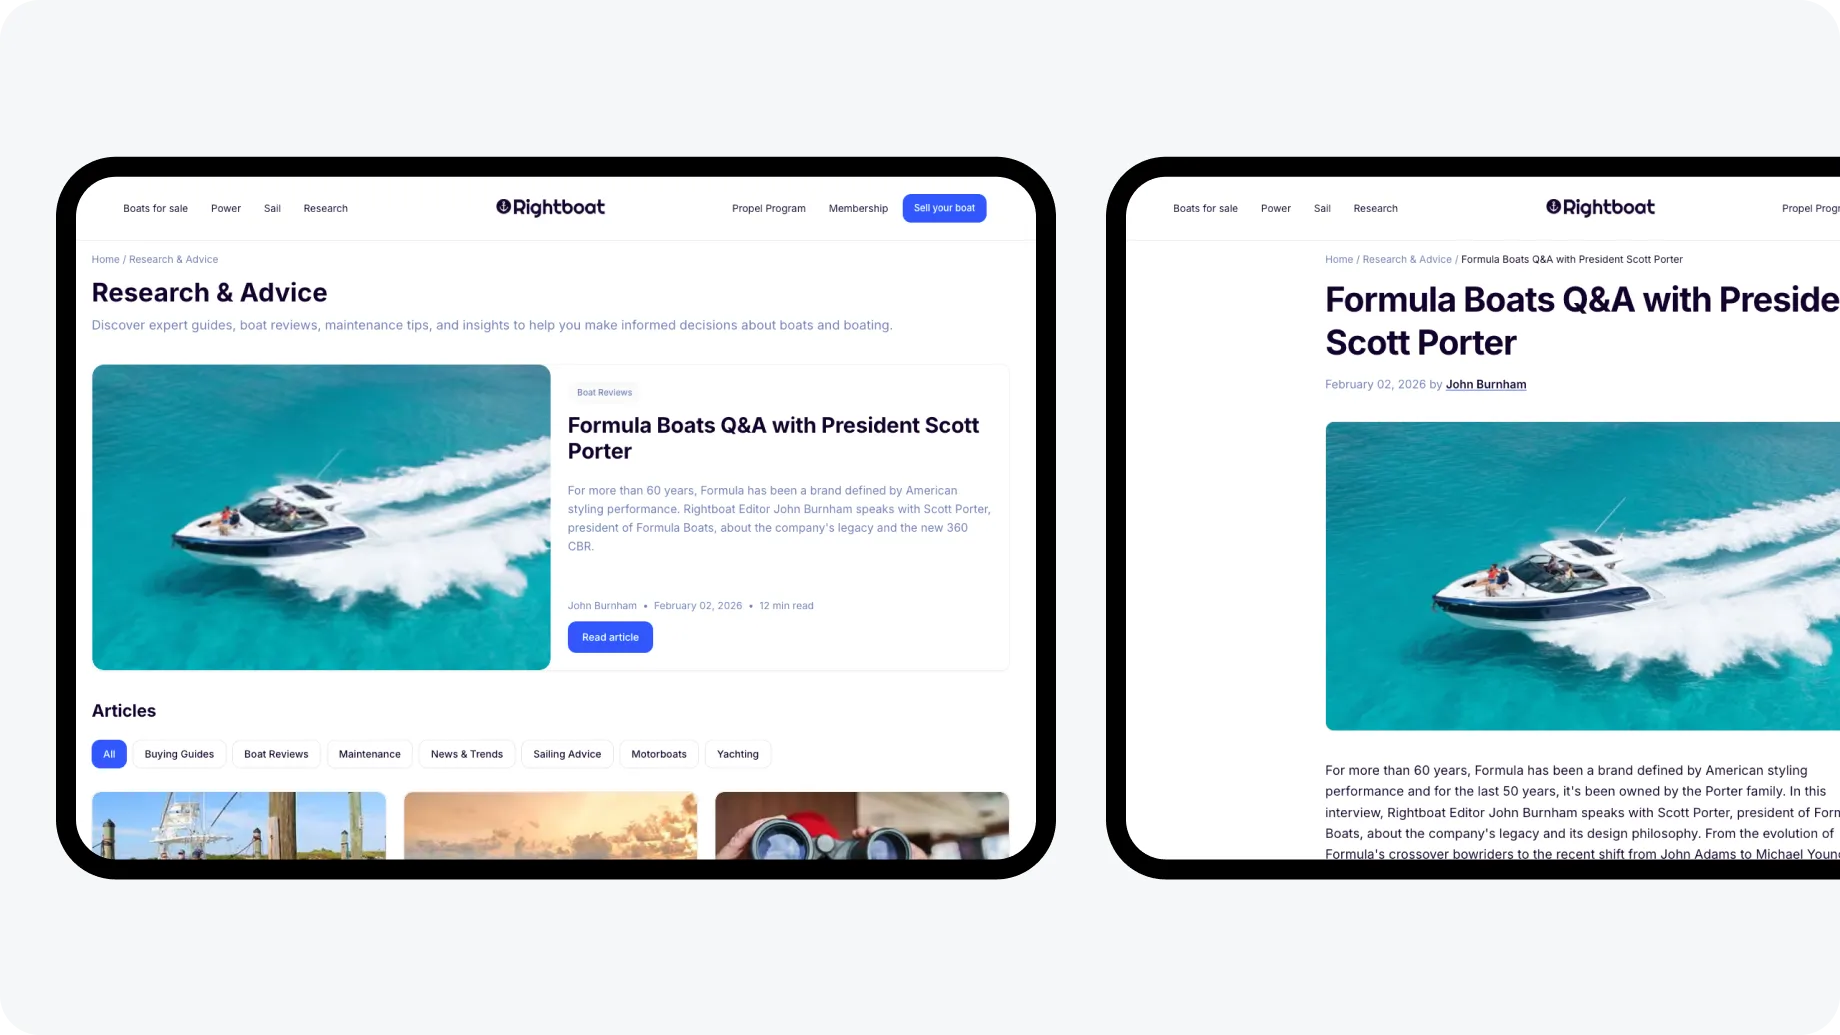
A UX audit as the way in. I opened the engagement with 20+ prioritized tasks, each justified by a UX law and estimated in effort. It became the client’s design agenda for the year. Quarterly delivery, not big-bang: Q1 explored (geographic search, Price History, AI categorization), Q2 took the highest-leverage page, Q3 the homepage, Q4 search.
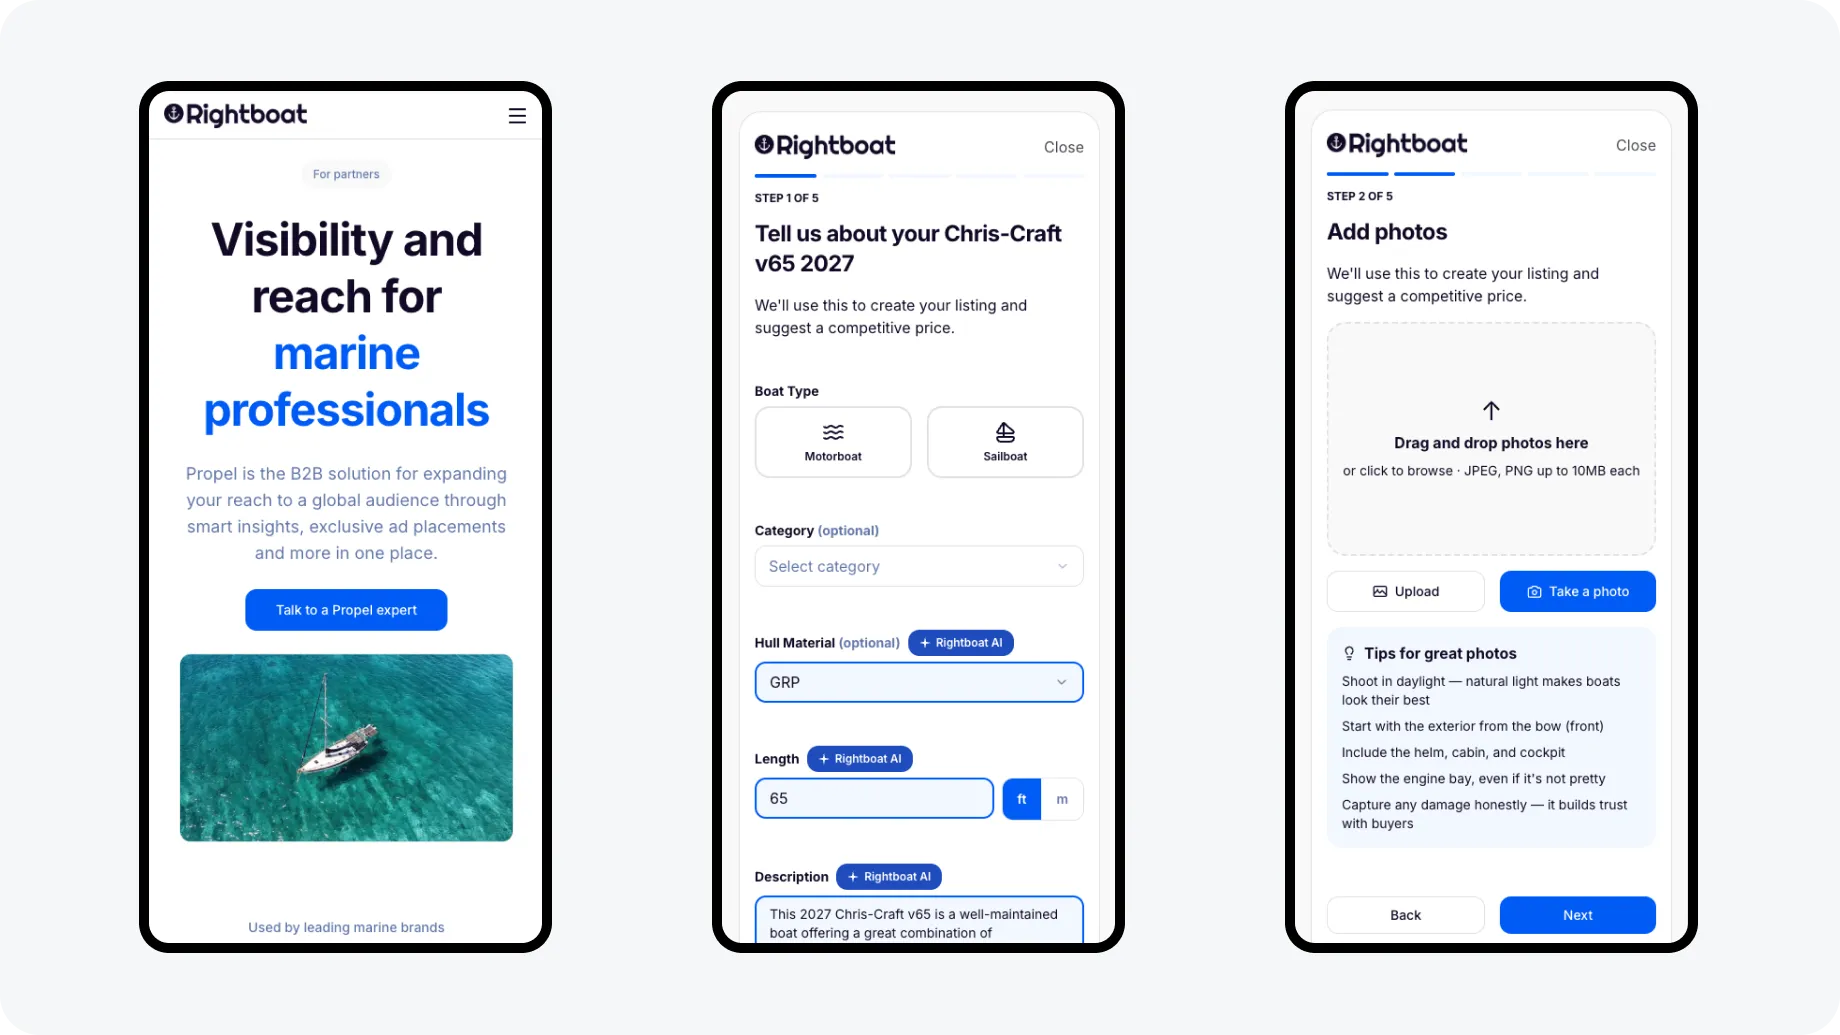
Homepage: five entry points for different buyer types — hero search, category cards, popular models, premium brands, featured brokers. Three layouts tested with six users; visual-first won.
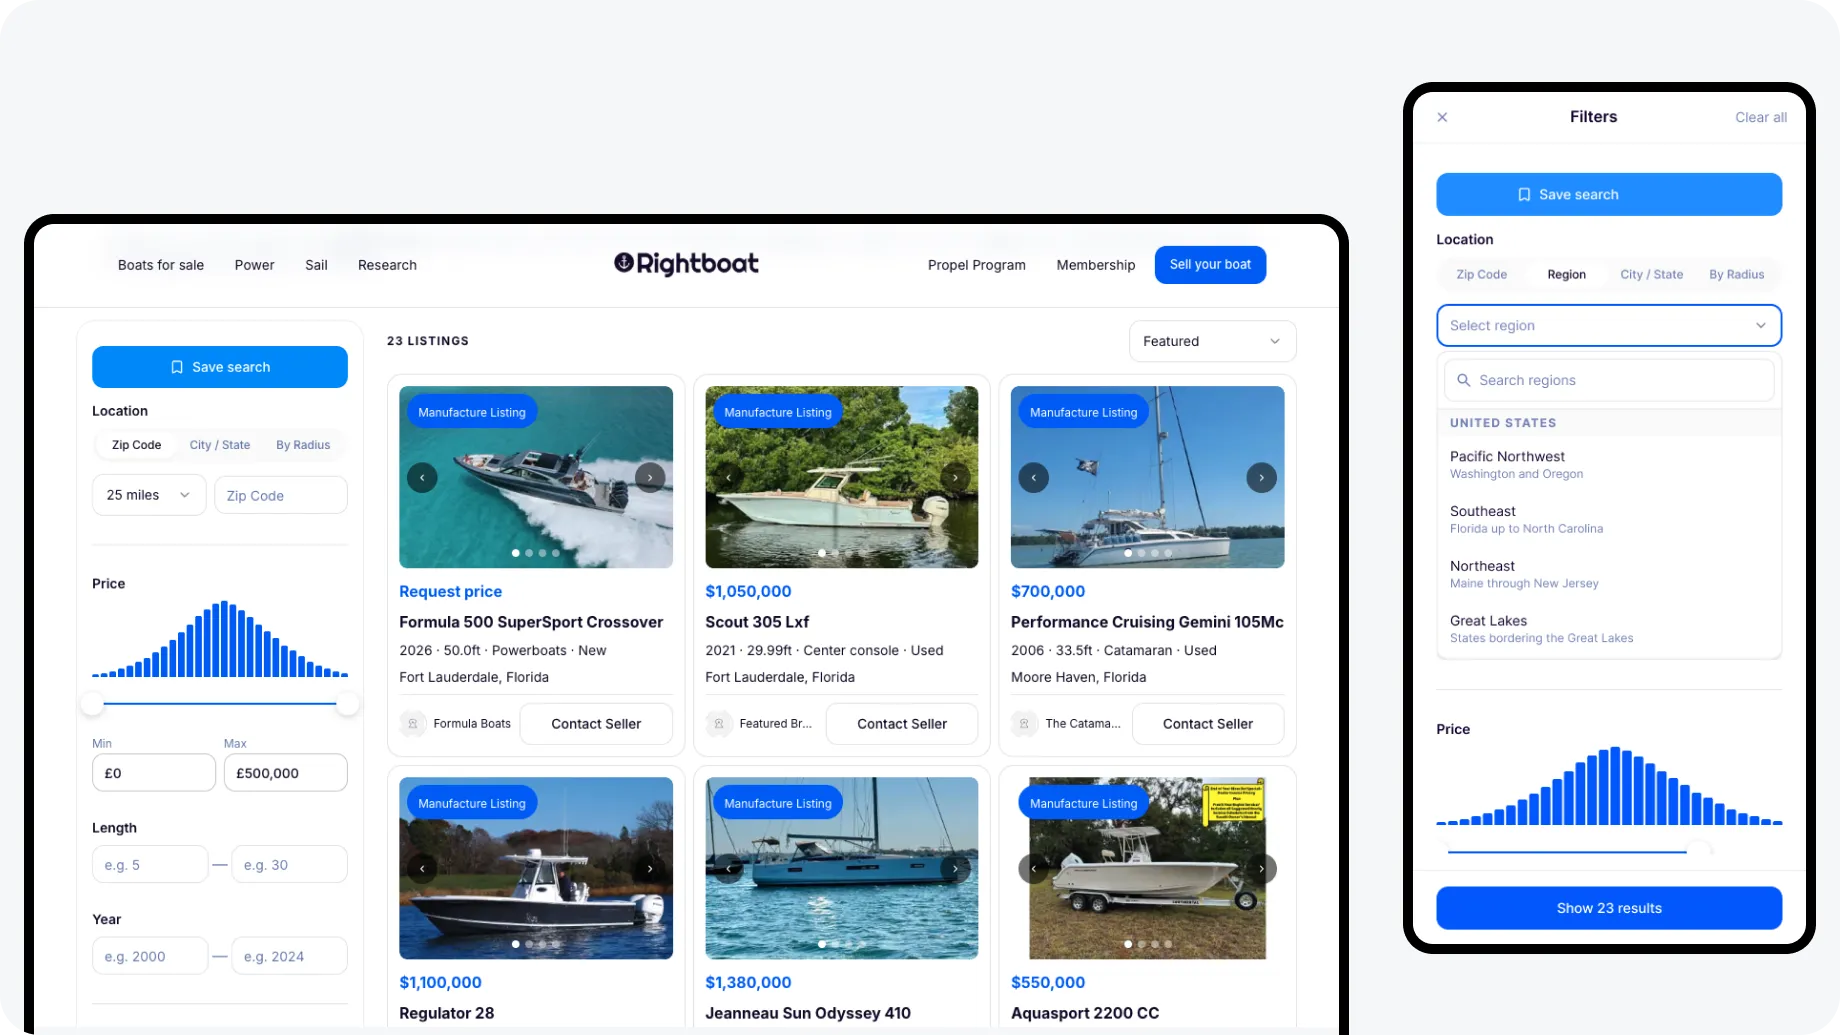
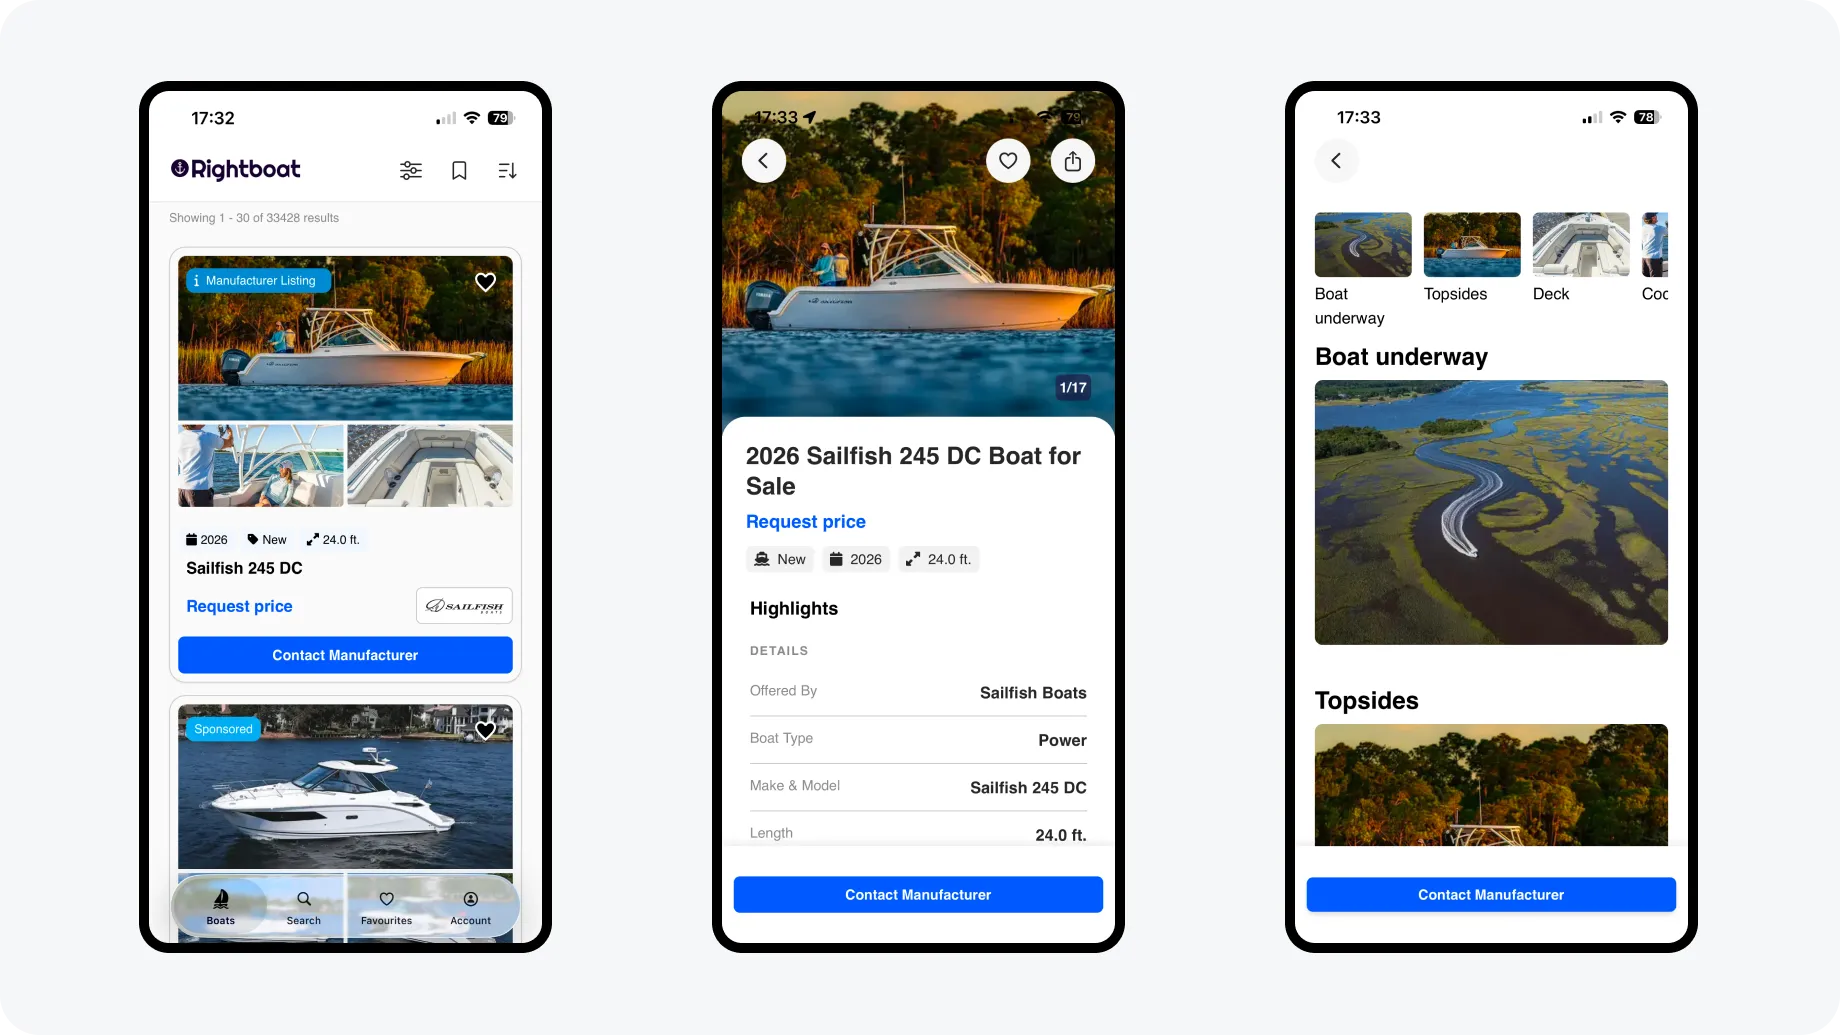
Search: listing cards rebuilt around hero image → title → location → price → specs. Smart badges, always-visible contact CTA, filter sidebar on desktop, bottom sheet on mobile.
Detail page: sticky contact form, AI-categorized gallery, scannable specs in tabs, and Price History — a chart of price evolution over time. The PM was skeptical; 8 of 10 users in interviews asked for pricing transparency. I championed it, prototyped it in Q1, and it became the differentiator: competitors hide prices, we show them.
Closing the Drift
The system existed. That is not the same as being true.
In August 2026 I audited both sources against each other, with one rule: measure the drift, don’t rebuild anything.
- 53 raw hex values → 0 in the prototype, replaced by tokens. Two were real drift, not noise: an AI tag using a blue that didn’t exist in the palette, and a chart using a stray Tailwind grey.
- 26 third-party library instances → 0 across the 20 live pages. They persisted because three components were missing — a section accordion, an icon-only button and a floating mobile nav. Built, then swapped.
- 137 hand-drawn icon containers on the seller-listing flow migrated to the official library.
- Color and type verified token by token — 36 primitives, 23 semantic tokens with Light and Dark modes, line-heights included.
- Code Connect coverage measured for the first time: Primitives 11/17, Patterns 7/18 — and the mapping on the most-used component in the library, the boat card, pointed at a property that didn’t exist, so not one of its variants resolved. 13 more nodes were dead after a restructure. All remapped and validated clean.
The last number is the useful one: the remaining gap is no longer mapping, it’s React components that haven’t been built yet. Knowing which of the two you’re looking at is the whole value of measuring.
The same week, the homepage was rebuilt from the Figma frame, pixel-checked at three breakpoints and shipped to production that day. Three reusable components fell out of it that hadn’t existed before.
Where Agents Fit — and Where They Don’t
Most of that audit was executed by coding agents. It only worked because of what surrounded them.
What they did: read the Figma file live, count instances, resolve node ids, diff tokens against CSS, find dead mappings, migrate icons, re-run the checks after each fix.
What they were not allowed to do: decide. Every brief carried the same hard constraints — name the source you’re working in before touching anything, because Figma, the prototype and production are three different truths; report first, fix only when asked; never rebuild, modernise or unify anything on the way past.
The design work stayed mine: the three missing components, the variants each one needed, which drift is a bug and which is a decision.
And the review is the job. On the boat-card mapping, the plausible failure was the agent quietly editing the component so the mapping would fit — which would have made the report green and the system wrong. That’s what I was reading for.
Speed of production isn’t quality of product. What agents bought here wasn’t hours: it’s that “Figma and code are in sync” became a claim with a number behind it.
Results
The traffic didn’t move. The efficiency did.
- +55% leads per page view — 0.0038 → 0.0059
- +61% email leads per month — 3,942 → 6,336, and +54% year over year in February
- 913 → 2,296 multi-leads per month: buyers contacting more than one seller, which is liquidity on both sides
- Flat page views (~1.04M → ~1.08M) — the constraint that gives the rest its value
Two years, three engineers, quarterly releases, no system to start from. The metrics are what the redesign did; the system is why the next quarter starts from the last one instead of from zero.
“Finally feels modern” — “Love the price history feature” — “So much easier on my phone”
What’s Next
The chain stops at the prototype. Closing it means three things, in order:
One artifact, three consumers. Figma variables exported through Style Dictionary into CSS custom properties for production, a Tailwind theme for the prototype and JSON for tooling — so alignment stops being manual. Blocked today on a single open brand decision on the client side, not on engineering.
Code Connect pointing at production. Today it maps the prototype’s React components. Extending it to the production codebase is the difference between a design tool and a team tool.
A design-system MCP server. Five queries against material that’s already written: token values, component specs, “does this component exist”, compliance checks, open questions. Its value isn’t serving the people who already follow the system — it’s answering the ones who would otherwise guess.
The order matters. An MCP doesn’t fix incomplete documentation; it serves it faster and with more authority. Which is why the drift got measured first.
What I Learned
- A design system is only real when the drift is measured — “Figma and code are in sync” is easy to claim. I audited both sources, found the mapping broken on the most-used component in the library, and fixed it. The audit is the deliverable.
- Agents scale execution, not judgment — they counted, diffed and migrated. What kept the output usable was the constraints in the brief and reading the result like it might be wrong.
- Phased delivery beats perfect plans — Q2 mobile data reshaped the Q3 homepage. Impossible in a big bang, and only affordable because each quarter inherited the last one’s components.